在本教學課程中,我們將建立一個簡單的 Go HTTP 伺服器,並透過新增一個計數器指標來儀表化它,以追蹤伺服器處理的請求總數。
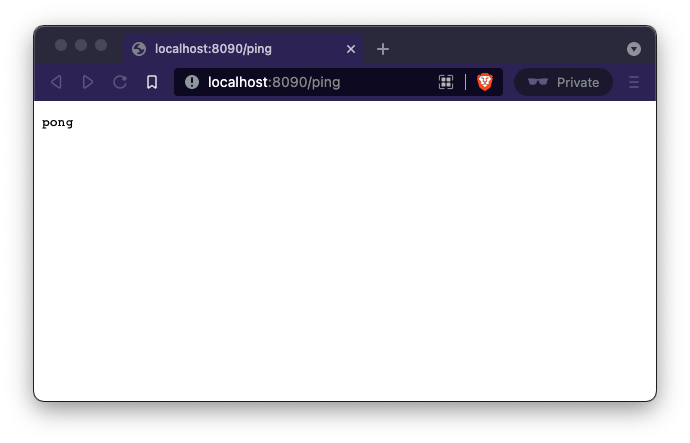
這裡我們有一個簡單的 HTTP 伺服器,具有 /ping 端點,該端點返回 pong 作為回應。
package main

import (
   "fmt"
   "net/http"
)

func ping(w http.ResponseWriter, req *http.Request){
   fmt.Fprintf(w,"pong")
}

func main() {
   http.HandleFunc("/ping",ping)

   http.ListenAndServe(":8090", nil)
}
編譯並執行伺服器
go build server.go
./server
現在在您的瀏覽器中打開 https://127.0.0.1:8090/ping,您應該會看到 pong。
現在讓我們為伺服器新增一個指標,該指標將儀表化向 ping 端點發出的請求數量,計數器指標類型很適合用於此,因為我們知道請求計數不會減少,只會增加。
建立 Prometheus 計數器
var pingCounter = prometheus.NewCounter(
   prometheus.CounterOpts{
       Name: "ping_request_count",
       Help: "No of request handled by Ping handler",
   },
)
接下來,讓我們更新 ping Handler 以使用 pingCounter.Inc() 增加計數器的計數。
func ping(w http.ResponseWriter, req *http.Request) {
   pingCounter.Inc()
   fmt.Fprintf(w, "pong")
}
然後將計數器註冊到預設註冊表並公開指標。
func main() {
   prometheus.MustRegister(pingCounter)
   http.HandleFunc("/ping", ping)
   http.Handle("/metrics", promhttp.Handler())
   http.ListenAndServe(":8090", nil)
}
prometheus.MustRegister 函數將 pingCounter 註冊到預設註冊表。為了公開指標,Go Prometheus 用戶端函式庫提供了 promhttp 套件。promhttp.Handler() 提供了一個 http.Handler,它公開了在預設註冊表中註冊的指標。
範例程式碼取決於
package main

import (
   "fmt"
   "net/http"

   "github.com/prometheus/client_golang/prometheus"
   "github.com/prometheus/client_golang/prometheus/promhttp"
)

var pingCounter = prometheus.NewCounter(
   prometheus.CounterOpts{
       Name: "ping_request_count",
       Help: "No of request handled by Ping handler",
   },
)

func ping(w http.ResponseWriter, req *http.Request) {
   pingCounter.Inc()
   fmt.Fprintf(w, "pong")
}

func main() {
   prometheus.MustRegister(pingCounter)

   http.HandleFunc("/ping", ping)
   http.Handle("/metrics", promhttp.Handler())
   http.ListenAndServe(":8090", nil)
}
執行範例
go mod init prom_example
go mod tidy
go run server.go
現在點擊 localhost:8090/ping 端點幾次,並向 localhost:8090 發送請求將會提供指標。
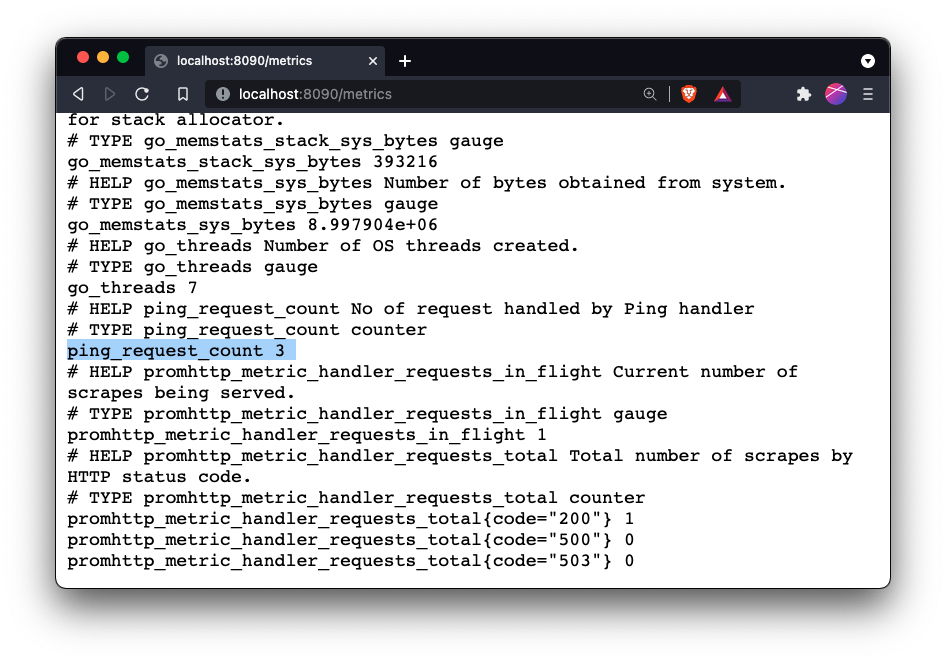
這裡 ping_request_count 顯示 /ping 端點被呼叫了 3 次。
預設註冊表帶有 go 執行時指標的收集器,這就是為什麼我們看到其他指標,如 go_threads、go_goroutines 等。
我們已經建立了第一個指標匯出器。讓我們更新我們的 Prometheus 設定以從我們的伺服器抓取指標。
global:
  scrape_interval: 15s

scrape_configs:
  - job_name: prometheus
    static_configs:
      - targets: ["localhost:9090"]
  - job_name: simple_server
    static_configs:
      - targets: ["localhost:8090"]
prometheus --config.file=prometheus.yml
這份文件是 開源的。請透過提交問題或拉取請求來協助改進它。