使用 Node Exporter 監控 Linux 主機指標
Prometheus Node Exporter 暴露了各種與硬體和核心相關的指標。
在本指南中,您將
- 在
localhost上啟動 Node Exporter - 在
localhost上啟動 Prometheus 實例,該實例已設定為從正在執行的 Node Exporter 抓取指標
安裝並執行 Node Exporter
Prometheus Node Exporter 是一個單一的靜態二進位檔案,您可以透過 tarball安裝。從 Prometheus 下載頁面下載後,將其解壓縮並執行
# NOTE: Replace the URL with one from the above mentioned "downloads" page.
# <VERSION>, <OS>, and <ARCH> are placeholders.
wget https://github.com/prometheus/node_exporter/releases/download/v<VERSION>/node_exporter-<VERSION>.<OS>-<ARCH>.tar.gz
tar xvfz node_exporter-*.*-amd64.tar.gz
cd node_exporter-*.*-amd64
./node_exporter
您應該會看到類似這樣的輸出,表示 Node Exporter 現在正在執行,並在 9100 埠上暴露指標
INFO[0000] Starting node_exporter (version=0.16.0, branch=HEAD, revision=d42bd70f4363dced6b77d8fc311ea57b63387e4f)  source="node_exporter.go:82"
INFO[0000] Build context (go=go1.9.6, user=root@a67a9bc13a69, date=20180515-15:53:28)  source="node_exporter.go:83"
INFO[0000] Enabled collectors:                           source="node_exporter.go:90"
INFO[0000]  - boottime                                   source="node_exporter.go:97"
...
INFO[0000] Listening on :9100                            source="node_exporter.go:111"
Node Exporter 指標
安裝並執行 Node Exporter 後,您可以透過 cURL /metrics 端點來驗證是否正在匯出指標
curl https://127.0.0.1:9100/metrics
您應該會看到類似這樣的輸出
# HELP go_gc_duration_seconds A summary of the GC invocation durations.
# TYPE go_gc_duration_seconds summary
go_gc_duration_seconds{quantile="0"} 3.8996e-05
go_gc_duration_seconds{quantile="0.25"} 4.5926e-05
go_gc_duration_seconds{quantile="0.5"} 5.846e-05
# etc.
成功!Node Exporter 現在正在暴露 Prometheus 可以抓取的指標,包括輸出中更下方各種系統指標(以 node_ 作為字首)。要檢視這些指標(以及說明和類型資訊)
curl https://127.0.0.1:9100/metrics | grep "node_"
設定您的 Prometheus 實例
您在本機執行的 Prometheus 實例需要正確設定才能存取 Node Exporter 指標。下列 prometheus.yml 範例設定檔會告知 Prometheus 實例從 Node Exporter 透過 localhost:9100 抓取指標及其頻率
global:
  scrape_interval: 15s

scrape_configs:
- job_name: node
  static_configs:
  - targets: ['localhost:9100']
要安裝 Prometheus,請下載適用於您平台的最新版本並解壓縮
wget https://github.com/prometheus/prometheus/releases/download/v*/prometheus-*.*-amd64.tar.gz
tar xvf prometheus-*.*-amd64.tar.gz
cd prometheus-*.*
安裝 Prometheus 後,您可以使用 --config.file 旗標指向您上述建立的 Prometheus 設定,啟動它
./prometheus --config.file=./prometheus.yml
透過 Prometheus 表達式瀏覽器探索 Node Exporter 指標
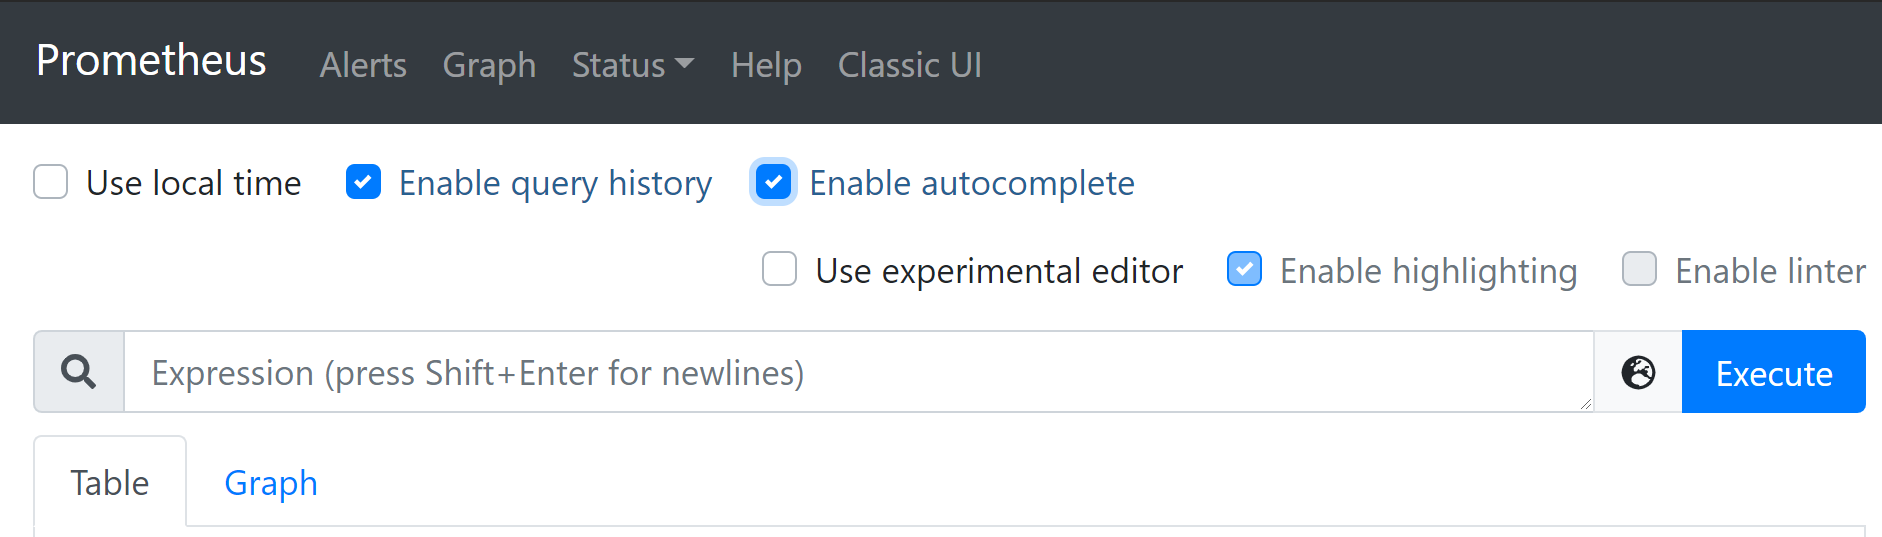
現在 Prometheus 正在從正在執行的 Node Exporter 實例抓取指標,您可以使用 Prometheus UI(又稱表達式瀏覽器)來探索這些指標。在您的瀏覽器中導覽至 localhost:9090/graph,並使用頁面頂部的主表達式列輸入表達式。表達式列如下所示
Node Exporter 的特定指標以 node_ 作為字首,包含 node_cpu_seconds_total 和 node_exporter_build_info 等指標。
按一下下方的連結以檢視一些範例指標
| 指標 | 意義 |
|---|---|
rate(node_cpu_seconds_total{mode="system"}[1m]) |
在過去一分鐘內,每秒花費在系統模式中的平均 CPU 時間(以秒為單位) |
node_filesystem_avail_bytes |
非 root 使用者可用的檔案系統空間(以位元組為單位) |
rate(node_network_receive_bytes_total[1m]) |
在過去一分鐘內,每秒接收的平均網路流量(以位元組為單位) |
本文件為開放原始碼。請提交問題或提取請求來協助改進。